| Contents of this topic: |
Links to related topics |
| Search Online Doc | |
| Spend Types | |
| Current Release Notes | |
The objective of the Savings feature is to help you increase savings. The Savings feature makes it easy to review and analyze savings from supply purchases, and to formulate strategies that avoid overpayments.
The Savings feature is designed both for casual users who need basic information, and for advanced users who require data about purchasing patterns that highlight areas for strategic change.
Savings encompasses:
Contract Savings - A high-level view of savings on contract purchases by corporation, region, and organization including graphs that depict trends.
Casual users can quickly see the savings across their entire corporation.
Project Savings - Savings data for projects with awarded contracts.
Savings and spend details accrue after at least one contract for a project is awarded.
Savings Opportunities - Data on Overpayments and Recoverable Savings.
Savings calculations begin on the activation date for a contract in the Contract Savings and Savings Opportunities panels, and on the award date in the Project Savings panels.
Customers have the option of enabling/disabling the Savings feature as part of their SCM package. This feature is enabled by default, so that the ability to work with Savings is available.
When this feature is disabled, users cannot work with Savings. The SCM main menu does not provide a Savings element. Also, when this feature is disabled:
Contact the Help Desk or your Premier Consultant to enable or disable this feature.
Suggestion: Read the discussion of spend and savings definitions and keep it open for reference as you go through this topic.
Contract savings, project savings, and savings opportunities data -- both summary and detailed data -- is sensitive to the organizations and regions allowed by the user's data profile. Users are only able to view savings and spend for organizations and regions included in their data profiles.
You do not need to activate contract prices to display savings available from an imported contract. You only need to mark the contract as "accepted." Once a contract is accepted, savings information for the contract and for matched contract items is displayed in the Savings feature.
If you have not activated contract items or updated your MMIS system with the new contract prices, the data in Savings represent what you would be saving if you were making purchases at the contract prices. In that case, purchasing dollars for the contract items are then captured in Savings Opportunities, available from the Savings menu.
Savings values are available for whole months only. If you activate a contract during a particular month, you will not see savings data until the following month.
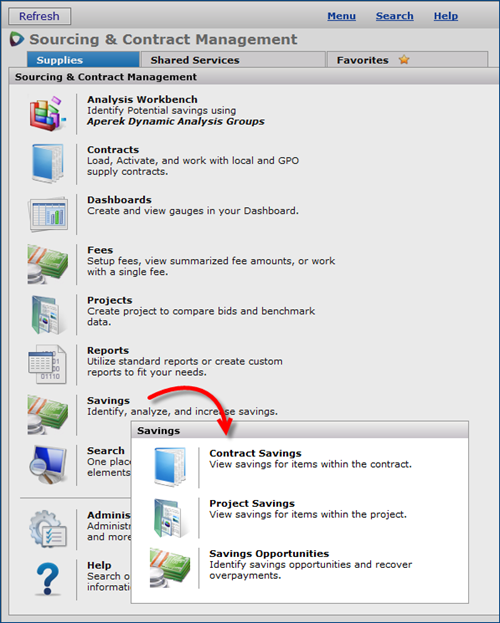
Savings displays and tools are available from the main Contents for all three types of savings (Figure 1).
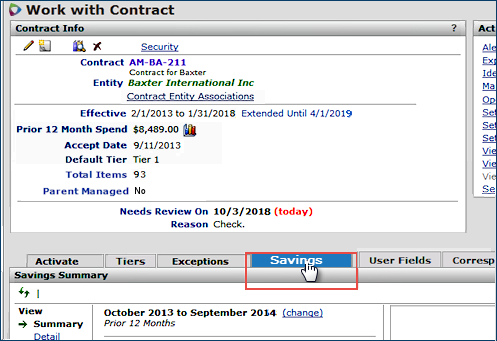
You can also display Savings Summary data for an individual contract from the "Work with Contract" page.
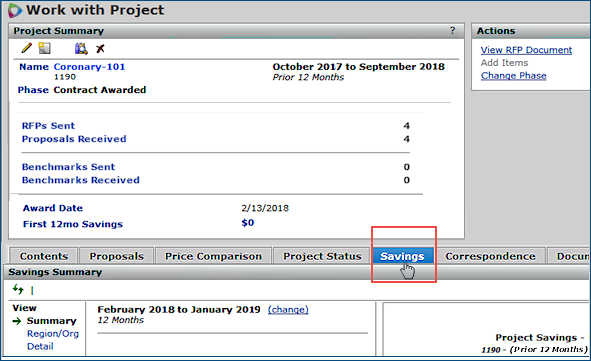
For a project, a Savings Summary panel is available from the "Work with Project" page.
Figure 3 - Accessing Savings for a Project
Contract savings includes dollars saved through on-contract purchases. Contract savings lets you determine if you are spending more or less by purchasing at a contracted price.
Contract Savings are calculated for the duration of the contract. A contract only needs to be accepted (not activated) to be available for savings calculations.
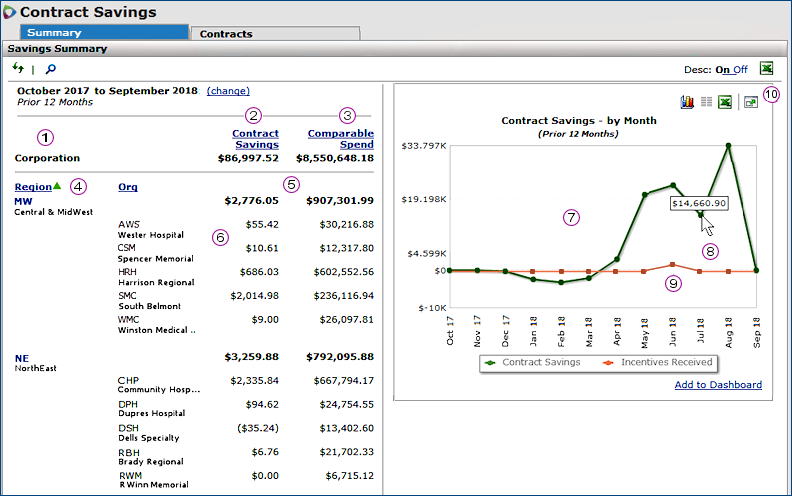
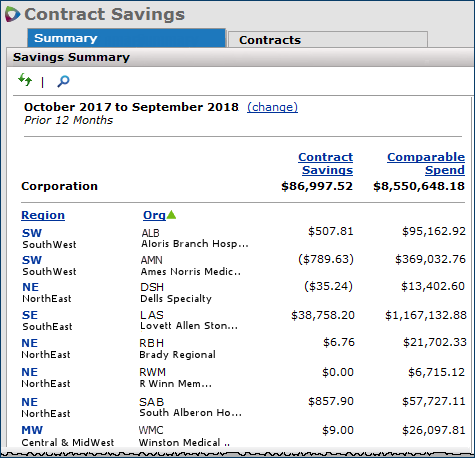
The "Contract Savings" page appears (Figure 4). The page contains two tabbed panels:
Savings Summary displays contract savings by corporation, region, and organization.
Contracts Savings displays savings by contract.
Note: Each number and description in this section matches a corresponding number in Figure 4 above.
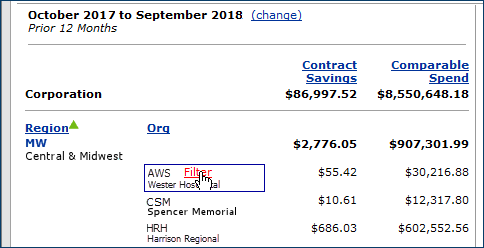
![]() The first line on the left-hand table (Figure 4) contains spend and savings data for an entire Corporation. Beneath the corporation data is a breakdown of savings and spend by region and organization. Only organizations with savings are listed in the panel.
The first line on the left-hand table (Figure 4) contains spend and savings data for an entire Corporation. Beneath the corporation data is a breakdown of savings and spend by region and organization. Only organizations with savings are listed in the panel.
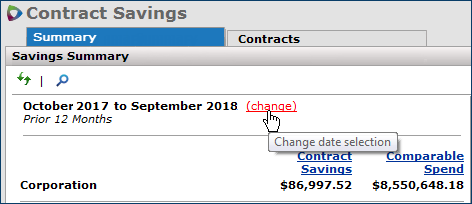
![]() Contract Savings, (Figure 4) is the computed savings for file and non-file items over the period of time specified in the date range (upper left). For the corporation in Figure 4, savings over the prior 12 months is $86,997.52. Savings stop accruing at the Contract End Date (or Extension Date).
Contract Savings, (Figure 4) is the computed savings for file and non-file items over the period of time specified in the date range (upper left). For the corporation in Figure 4, savings over the prior 12 months is $86,997.52. Savings stop accruing at the Contract End Date (or Extension Date).
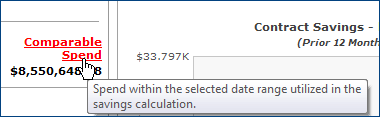
![]() Comparable Spend, (Figure 4) is the spend for the time frame used in the savings calculation. The savings and spend values appear together to provide context for savings in terms of what was spent. In Figure 4, the corporation's savings ($86,997.52) is based on spend of $8,550,648.18.
Comparable Spend, (Figure 4) is the spend for the time frame used in the savings calculation. The savings and spend values appear together to provide context for savings in terms of what was spent. In Figure 4, the corporation's savings ($86,997.52) is based on spend of $8,550,648.18.
![]() The Region column lists regions (Figure 4). To the right is spend and savings for each region.
The Region column lists regions (Figure 4). To the right is spend and savings for each region.
The table is sorted by region, descending, by default. But, you can sort in ascending order by clicking the Region column header. The user has done this in Figure 4.
![]() Contract savings dollars and comparable spend are displayed in bold for each region, (Figure 4). In the example in Figure 4, contract savings for region MW is $2,776.05 for comparable spend of $907,301,99.
Contract savings dollars and comparable spend are displayed in bold for each region, (Figure 4). In the example in Figure 4, contract savings for region MW is $2,776.05 for comparable spend of $907,301,99.
![]() Each region's organizations are listed below the region and to the right (Figure 4). If savings data exist for an organization, they are displayed. For example, organization AWS in the MidWest (MW) region had contract savings of $55.42 for comparable spend of $30,216.88. (All organizations are listed, including organizations that have no contract savings.
Each region's organizations are listed below the region and to the right (Figure 4). If savings data exist for an organization, they are displayed. For example, organization AWS in the MidWest (MW) region had contract savings of $55.42 for comparable spend of $30,216.88. (All organizations are listed, including organizations that have no contract savings.
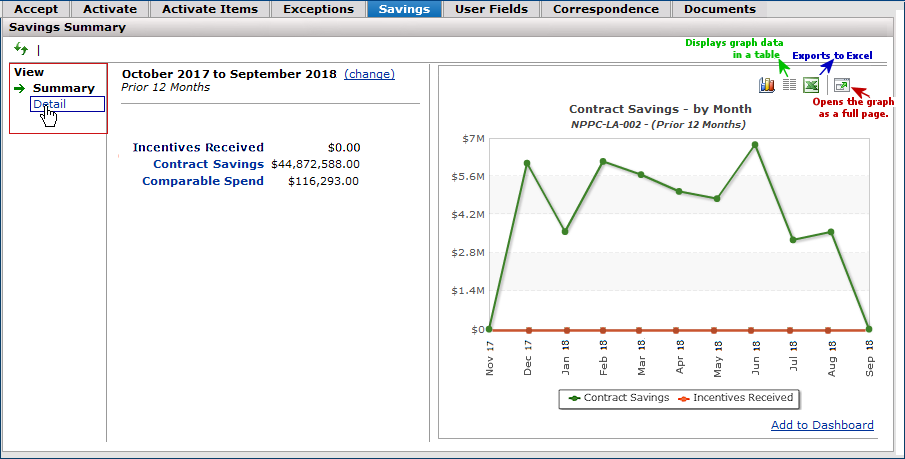
![]() The right-hand graph plots the trend of the corporation's contract savings by month for the time period (Figure 4).
The right-hand graph plots the trend of the corporation's contract savings by month for the time period (Figure 4).
The graph changes depending on the time frame selected, and the region(s) or organization(s) in focus in the table. For example, if you filter on the MW region in the table, the graph displays only data for the organizations in that region. Another example is in Figure 12.
![]() Mouse over any month's node to display the savings value (Figure 4).
Mouse over any month's node to display the savings value (Figure 4).
![]() The contracts had a small bump in incentives received in July. No incentives were earned in other months.
The contracts had a small bump in incentives received in July. No incentives were earned in other months.
![]() The display icons are on the upper right-hand side of the panel (Figure 4).
The display icons are on the upper right-hand side of the panel (Figure 4). 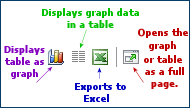
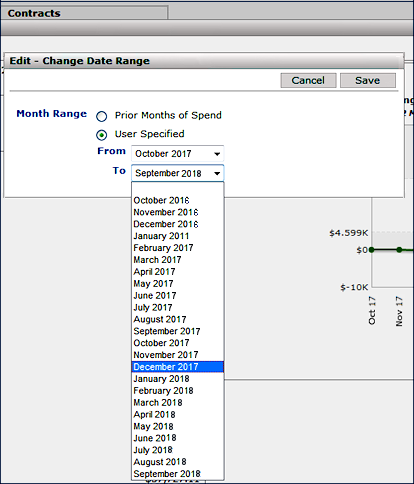
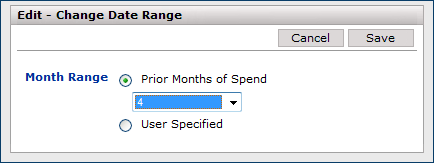
The date selection lets you specify a time frame window into spend for contract savings (project savings, and savings opportunities). For example, you may have a contract with several years of purchasing activity and savings, but you only wish to review savings for the past eight months. Changing the date range to the last eight months puts spend for that time frame in focus.
Figure 7 - Changing the Date Range
|
Figure 9 - Selecting a Month and Year |
Figure 8 - Selecting a Number of Months |
On the Contract Savings Summary panel, you can filter by Region, by Org, or by both.
Figure 10 - Filter the Contract Summary Savings by Region |
Figure 11 - Filter the Contract Summary Savings by Org |
Figure 12 is the result of filtering Figure 10 by Region. The Filters tool, (Figure 12), specifies how the data are filtered.
Notice that the graph displays data for the filtered region (MW).
The Clear and Remove filter tools appear on the upper left side (Figure 12).

The Contracts Saving Summary data can be exported in Excel format.
Several other icons appear on the "graph side" of the panel:
The Contracts Savings Summary panel uses the standard list search.
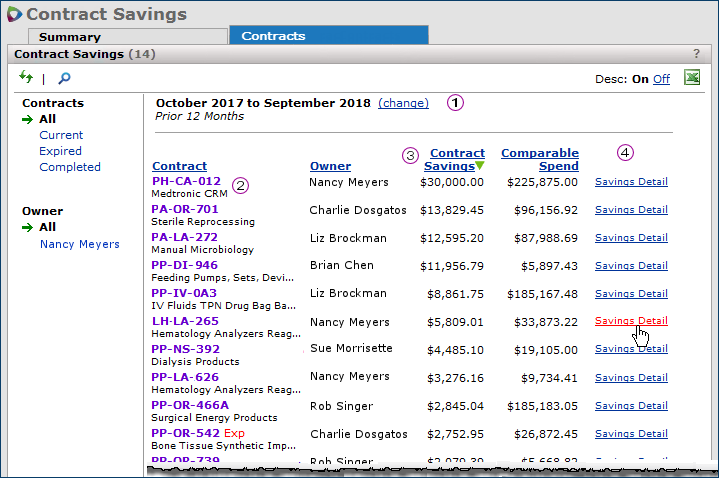
Figure 13 is an example of the Contract Savings panel. This panel lists contracts with savings for the same organizations and regions displayed in the summary list (Summary tab).
The default sort is by the Contract Savings column, descending (best to worst savings values).
Clicking any underlined column header sorts the table by that column. The green arrow
indicates the sort column and the direction of sort.
The filters on the left let you view All, Current, Expired, or Completed contracts, and contracts that you own, or All owners' contracts.
The Contract Savings panel (Figure 13) is sensitive to the filter that you selected on the Savings Summary panel (Figure 4), and to the time frame that you identified (if other than the default).
If you filter the Savings Summary panel for a particular Region, the Contract Savings panel displays all contracts for the region.
If you filter the Savings Summary panel by the organization (Org), only contracts for the organization appear on the Contract Savings panel.
Note: Each number and description in this section matches a corresponding number in Figure 13 above.
![]() The default time frame for the savings data is the Prior 12 Months (Figure 13). You can change the time frame by clicking Change. Detailed instructions are in the previous section.
The default time frame for the savings data is the Prior 12 Months (Figure 13). You can change the time frame by clicking Change. Detailed instructions are in the previous section.
![]() Clicking a contract number opens the "Work with Contract" page for that contract (Figure 13).
Clicking a contract number opens the "Work with Contract" page for that contract (Figure 13).
![]() The definitions of Contract Savings and Comparable Spend appear in a pop-up window when you mouse over them. Details about these values are in the Savings Summary section (Figure 13).
The definitions of Contract Savings and Comparable Spend appear in a pop-up window when you mouse over them. Details about these values are in the Savings Summary section (Figure 13).
![]() Clicking Savings Detail (Figure 13) opens a page of summary savings for the contract, as shown in Figure 14.
Clicking Savings Detail (Figure 13) opens a page of summary savings for the contract, as shown in Figure 14.
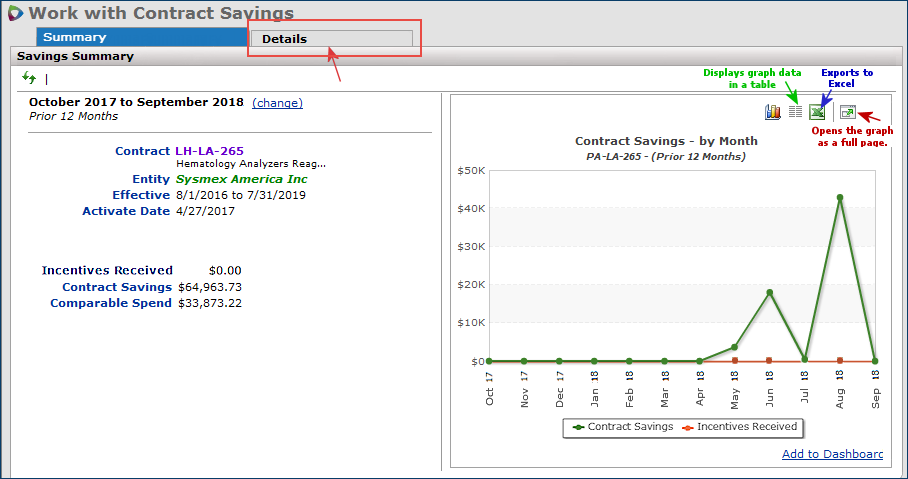
(The user has clicked Savings Detail.)
When a contract is created as a result of an award to a project bid, you can open the project by clicking View Project Details next to the Activate Date.
Clicking the Details tab provides savings information on individual items (Figure 15A).
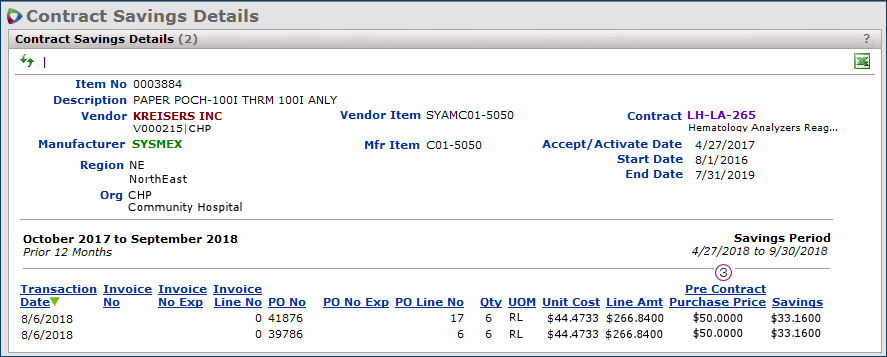
The contract Savings Details panel is in Figure 15A. The panel displays item savings by organization (Org) for each item on the contract. Contract Savings and Comparable Spend are defined previously.
Date Ranges
In Figure 15A, the red arrow points to the date range "window" into savings on the contract. (This date range is selectable. The user had previously selected the prior 12 months in Figure 12.)
The green arrow (Figure 15A) points to dates for which savings data are available for the contract. The contract was activated on 4/27/2012 and since the current month is October, data is available up to the end of September. (In this case, only six months of savings data exist for this contract. Even though the time display on the left side is for 12 prior months, only six months are available.)
Several tools are available to help you pinpoint savings information for individual contract items. These tools are located on the left hand side of the contract panel.
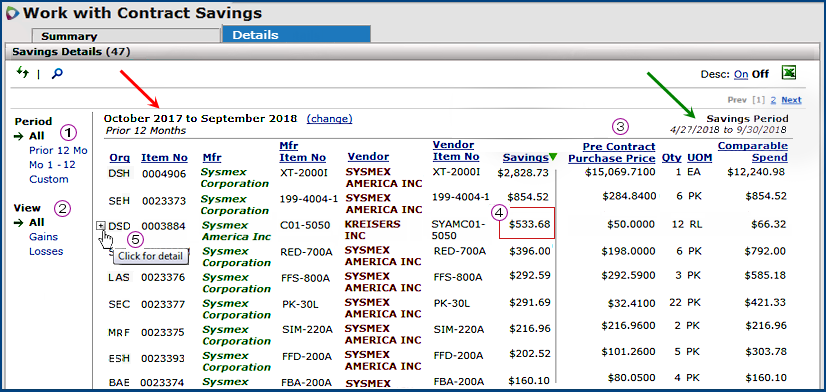
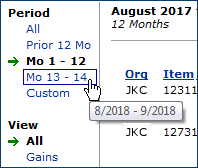
![]() Period (Figure 15A) lets you select the number of months of savings to view. The values under Period depend on how long the data has been available for the contract. You can also select a time frame using the change link next to the dates (see Figure 15A, the red arrow). The Period views are shortcuts. (You may wish to view more/fewer months than the date range you have selected, or fewer than the months of savings data available.)
Period (Figure 15A) lets you select the number of months of savings to view. The values under Period depend on how long the data has been available for the contract. You can also select a time frame using the change link next to the dates (see Figure 15A, the red arrow). The Period views are shortcuts. (You may wish to view more/fewer months than the date range you have selected, or fewer than the months of savings data available.)
Also, if you have selected a time frame on one of the displays that you used to drill down to contract details; for example, if you set a time frame in the summary Contracts Savings panel (Figure 13), that time frame persists for the contract item savings details.
Note: Keep this fact in mind if data appears for fewer months than you know you have: you may have set the time frame for fewer months on a higher-level panel.
You can change the time frame using one of the selections under Period.
All - Displays data for all months of spend for the contract items. This is the default setting, unless a different time frame has been specified on higher level panels.
Prior 12 Mo - Displays the previous twelve months of data (or, if the contract is less than 12 months old, the number of months available).
Mo 1 - x - One or more selectable intervals of months appear if data exists for more than 12 months. Otherwise, this option displays data for the number of months available.
|
For example, a contract that was activated three years ago will have a set of selectable options like these: |
 |
The example in Figure 15A is a contract for which six months of data are available. (When 12 or fewer months of data are available, the options All, Prior 12 Mo, and Mo 1 - x display the same information.)
Custom - If you have set a custom From and To month and year on higher level panels, by default, that time frame is replicated on the contract Savings Details.
If no time frame has been set on higher level panels, the default is All.
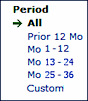
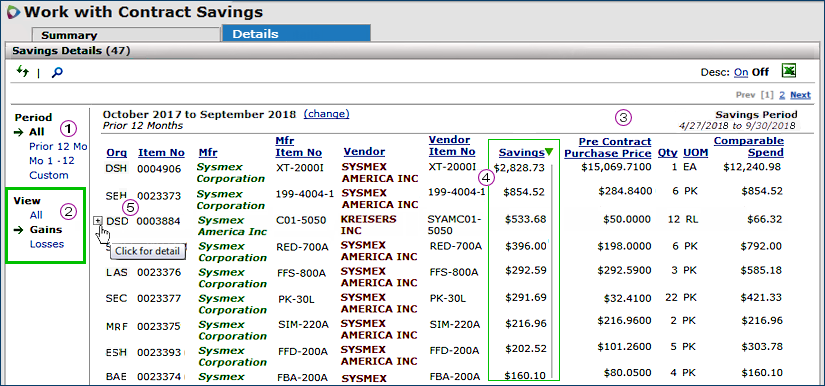
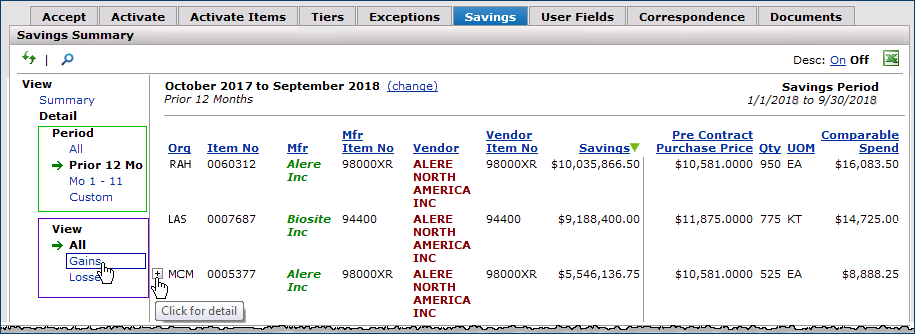
![]() View (Figure 15A) toggles the display between items that show savings Gains, savings Losses, and savings data for All items (both gains and losses).
View (Figure 15A) toggles the display between items that show savings Gains, savings Losses, and savings data for All items (both gains and losses).
Figure 15A displays savings data with View set to All.
Figure 15B displays savings gains.
Figure 15C displays savings losses: only one item with MIN 106-4002-0 has a savings loss. Savings losses are in parentheses.
![]() Pre-contract prices and transaction information (Figure 15A) are available by clicking a value in the Pre-Contract Purchase Price column.
Pre-contract prices and transaction information (Figure 15A) are available by clicking a value in the Pre-Contract Purchase Price column.
A popup panel appears (Figure 16A).
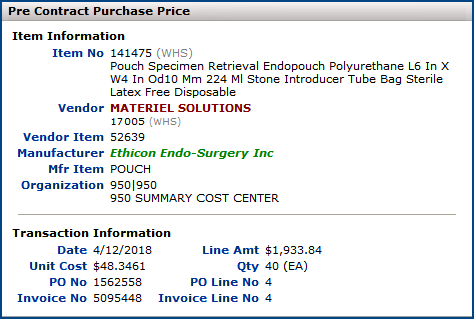
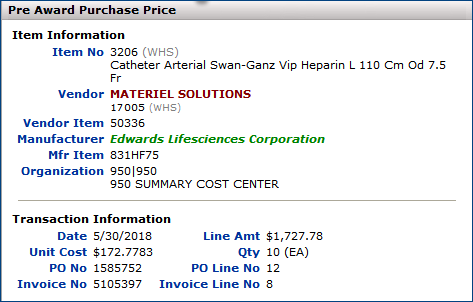
The Transaction Information (Figure 16A) displays the date of the last purchase order for the item, the unit cost of the item on the PO line, the quantity ordered, the PO line amount (quantity x unit cost), the line number for the item on the PO, the line number on the invoice, if any, and the invoice number, if any.
![]() The Savings column (Figure 15A) contains savings dollars for each item on the contract. Click the header to sort the column in ascending/descending order. You can sort any column with an underlined header.
The Savings column (Figure 15A) contains savings dollars for each item on the contract. Click the header to sort the column in ascending/descending order. You can sort any column with an underlined header.
 Mousing over an item row (Figure 15A) displays a plus sign "+". Clicking the "+" opens the Item Details panel (Figure 16C).
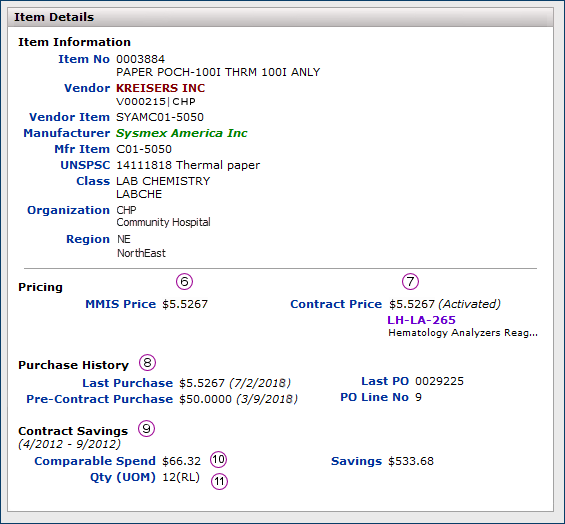
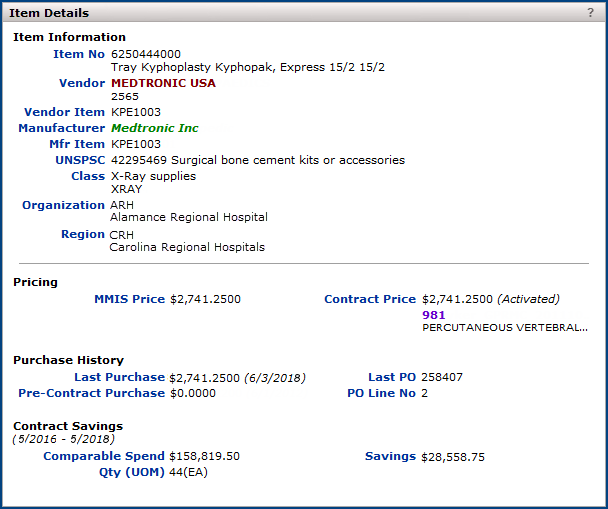
The top part of the Contract Item Details panel (Figure 16C), called Item Information, displays information about the item including the Item No (from the item record in the MMIS system), the Vendor, Manufacturer, VIN, MIN, UNSPSC code, and in this case, the Class and Subclass. When Class and Subclass are used at a site, they are displayed (otherwise these fields are blank). The Organization and Region are listed as well.
The bottom part of the panel (Figure 16C), contains pricing information, purchasing history for the item, and contract savings. Note: You can access this panel from other parts of Sourcing and Contract Management. If the item is not matched on a contract, the Contract Price and the Contract Savings fields are blank.
Note: Each number and description in this section matches a corresponding number in Figure 16C above.
![]() MMIS Price- The price from the item vendor record in the site's MMIS system. This price is a landed price (i.e., it includes any vendor markup). Your hospital may have the ERP - Materials Management application or another system as its MMIS.
MMIS Price- The price from the item vendor record in the site's MMIS system. This price is a landed price (i.e., it includes any vendor markup). Your hospital may have the ERP - Materials Management application or another system as its MMIS.
![]() Contract Price - The price on the contract where the item is matched. This price is a landed price. When the MMIS Price and the Contract Price are different, the two prices are highlighted in yellow.
Contract Price - The price on the contract where the item is matched. This price is a landed price. When the MMIS Price and the Contract Price are different, the two prices are highlighted in yellow.
Note: The contract price does not have to be activated.
![]() Purchase History - Contains data about the last purchase of the item.
Purchase History - Contains data about the last purchase of the item.
![]() Contract Savings contains savings data. The time frame (either the default, or the dates that you selected) and savings available for the time frame on the item are displayed.
Contract Savings contains savings data. The time frame (either the default, or the dates that you selected) and savings available for the time frame on the item are displayed.
![]() Comparable Spend - The spend for the time frame used in the savings calculation.
Comparable Spend - The spend for the time frame used in the savings calculation.
![]() Qty (UOM) - The quantity of the item and the UOM for the quantity from the purchase history.
Qty (UOM) - The quantity of the item and the UOM for the quantity from the purchase history.
For any given contract, you can view savings data from the Savings panel on the "Work with Contract" page. (Figure 17)
The same tools are available as from the Savings feature menu, on the main Table of Contents, but arranged slightly differently.
The Contract Savings Details panel appears (Figure 18).
The Period and View tools on the left function the same as described previously.
Columns with underlined headers can be sorted. The sort icon (green arrow) indicates the sort column and the direction of the sort (ascending or descending).
Column definitions are the same as those on the version of this panel available from the main Savings menu in the Table of Contents; e.g.,
Savings is savings from purchasing item on contract.
Comparable Qty is the quantity of the item for the time frame of the calculation.
Comparable Spend - The spend for the time frame used in the savings calculation.
Excel Export: The Contract Savings Details data can be exported in Excel format.
The Excel export includes the panel's fields, and these columns that are not visible on the panel:
Pre-Award Purchase Price Date - The last date when the pre-award purchase price was valid.
Last Purchase Price - The price of the item when it was last purchased.
Last Purchase Price Date - The date of the last purchase of the item.
MMIS Price - The "landed" price from the item vendor record in the site's MMIS system's item file, or in the Item Catalog.
Contract Price - The "landed" price from the contract.
Contract No - The contract number.
Contract Name - The contract name.
Contract Status - Matched or activated.
UNSPSC and UNSPSC Description - UNSPSC information for the item.
Item Class and Item Class Description - The class that the item belongs to, if any, as designated by the site.
Item Sub Class and Item Sub Class Description - The subclass for the item, if any.
Sourcing and Contract Management tracks project savings for all project items once a contract has been awarded on the project. You can work with savings for all projects or any project from the Savings feature.
The "Project Savings" page appears, with the Savings Summary panel displayed (Figure 19).
The summary values for product spend are aggregated in this display.
The Project Savings Summary lets you see all the savings from all projects for a designated period. The default period is the last twelve months, but you may change to another period by clicking change.
Only Regions/Organizations with project savings will be displayed.
The summary information can be filtered by Region or Organization. The list is sensitive to your Region/Org data profile security. You will only view spend for Regions and Organizations to which you have access.
The page contains two tabbed panels:
Savings Summary displays project savings by corporation, region, and organization.
Projects displays a list of projects for which contracts have been awarded.
Clicking on the Projects tab at the top takes the user to a Project Savings list (Figure 20).
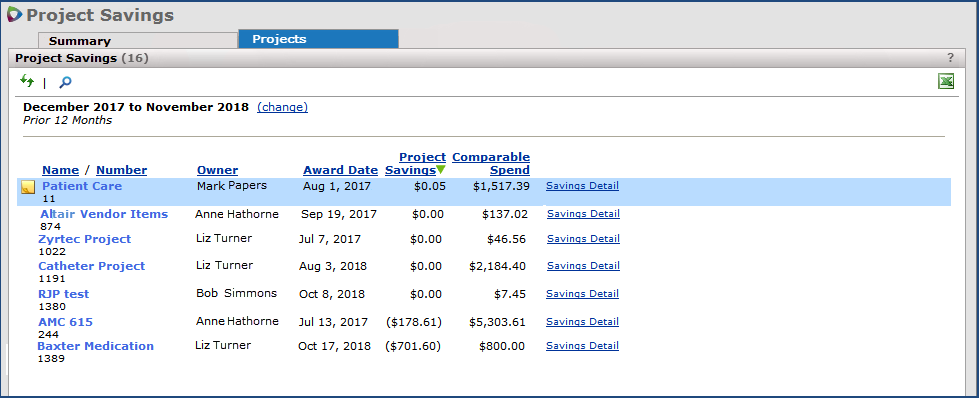
This Project Savings list displays any project that is eligible to accumulate savings; in other words, projects in which at least one contract has been awarded.
The default sort is by the Project Savings column, descending (best to worst savings values).
Clicking any underlined column header sorts the table by that column. The green arrow ![]()
![]() indicates the sort column and the direction of sort.
indicates the sort column and the direction of sort.
Users can export the panel to Excel by clicking the Excel icon ![]() in the upper right. The Excel import includes these columns:
in the upper right. The Excel import includes these columns:
Project Name
Project Number
Owner
Award Date
Project Savings
Comparable Spend
Elsewhere on the panel:
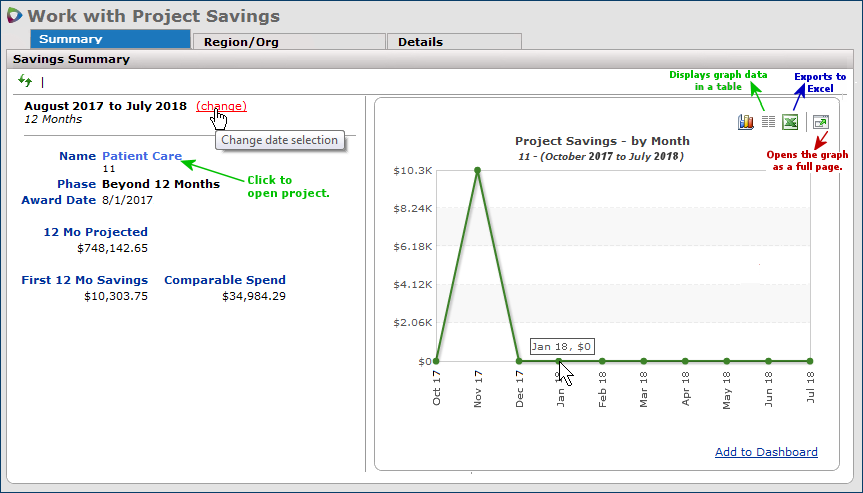
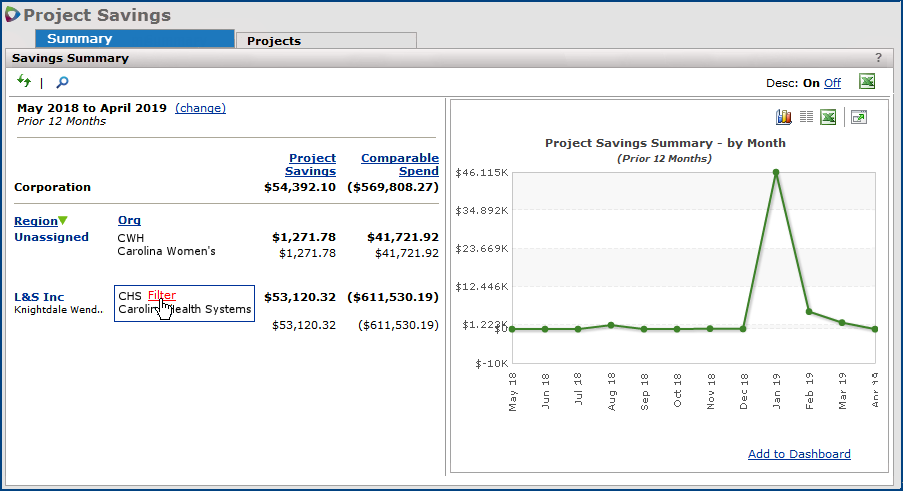
The "Work with Projecting Savings" page Savings Summary panel (Figure 21) displays overall project information, including the project name and number, the Phase of the project, Projected Savings for the next twelve months, and savings for the first 12 months after a contract was awarded on the project.
On the left side:
- Award Date is the date when the first contract (if there are several) in the project was awarded to a bid. This date triggers the calculation of savings for the project.
- First 12 Mo Savings is the computed savings for file and non-file items in the project.
Project savings begins to accrue when the first contract on a project is awarded. Project savings are calculated for three years after the award date.
The calculation of project savings is: (Pre-Award Price * Comparable Qty) - Comparable Spend.
- Comparable Spend is the spend for the time frame used in the savings calculation for the quantity purchased during the time frame. Comparable spend provides context for savings in terms of what was spent. When you mouse over either Contract Savings or Comparable Spend, a tool tip appears with the definition.
The right side plots project savings by month.
Tabs:
The Region/Org tab opens a panel that displays project savings by region and organization (Region/Org Project Savings).
The Details tabbed panel contains project item savings (Savings Details).
The tools on these panels are similar to the tools on the Contract Savings panels.
Changing the Date Selection
The date range on the left of the panel is a "window" into the total time frame for savings in the project. This date range is selectable.
Also, the date range that you set persists when you drill down to the Reg/Org panel and the Details panel.
If you change the date on the Project Savings Summary panel (Figure 21), the new time frame is inherited by the lower-level panels: Region/Org Project Savings and item Savings Details.
However, if you change the date on a lower-level panel, it does not affect the Project Savings Summary panel, which always contains savings within the first twelve months after the first awarded contract.
Viewing Region and Organization Savings in a Project
Filters
You can filter by Region, by Org, or by both.

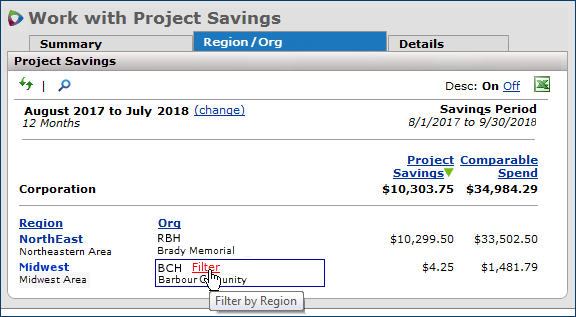
Figure 24 is the result of filtering Figure 22 by Region. The Filters tool, on the upper left-hand side of the panel, specifies how the data are filtered.
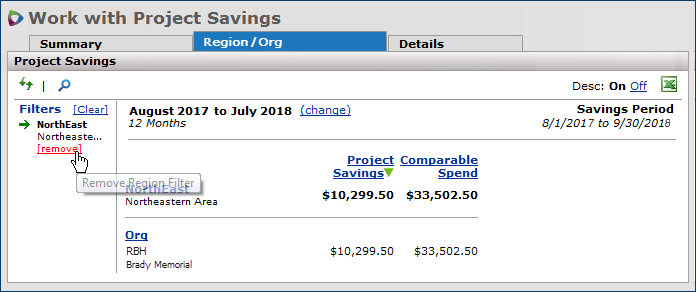
The Clear and Remove filter tools appear on the upper left-hand side of the panel (Figure 24).
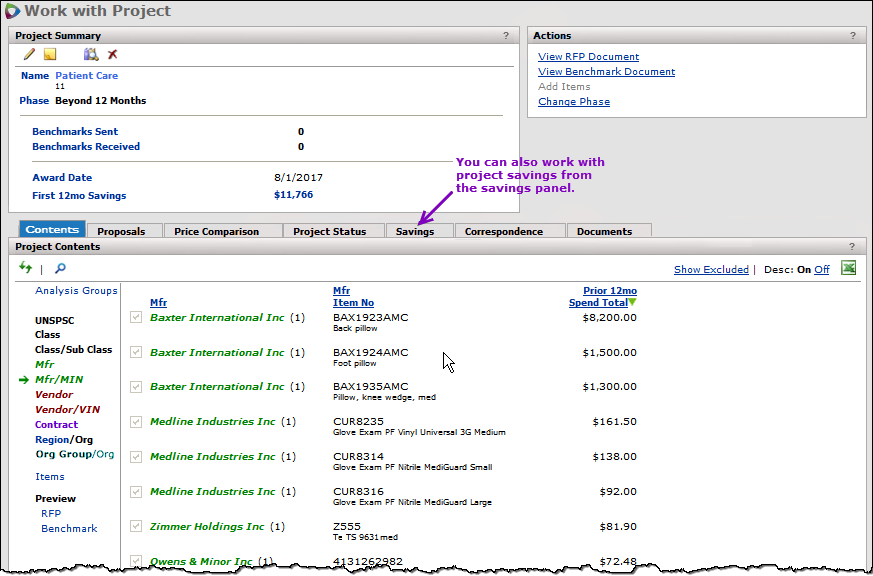
On the "Work with Project Savings" page Savings Summary panel (Figure 21):
Panels on the "Work with Project" page (Figure 25) identify project items; list bids and awarded contracts; provide a comparison of prices; display documents; and more. Details are in the topic "Work with Analysis Projects."
The Savings Details panel appears (Figure 26).
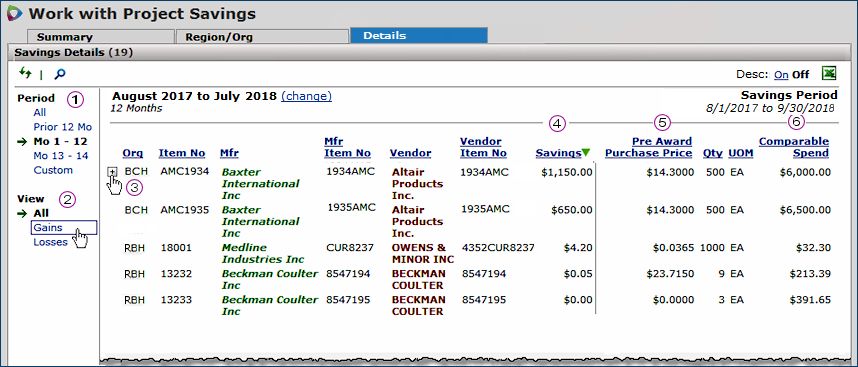
Note: Each number and description in this section matches a corresponding number in Figure 26 above.
|
The months selections change dynamically from project to project, depending on how long a project has had awarded contracts. Mouse over any of the Period values to display a tool tip with the specific dates; for example:
See the previous discussion for details on using this tool. |
![]() View (Figure 26) toggles between items with savings gains and losses. The default view is All items.
View (Figure 26) toggles between items with savings gains and losses. The default view is All items.
See the discussion of this tool in the Contract Savings section.
![]() Hovering the mouse over the organization (Figure 26) displays a plus sign "+." Click + to open the item savings details.
Hovering the mouse over the organization (Figure 26) displays a plus sign "+." Click + to open the item savings details.
![]() The Savings column (Figure 26) contains savings dollars for each item in the project. Project savings compares what has actually been paid for items after contracts are awarded to what was paid before. For this panel, the Savings column is the default sort column, in descending order, from highest to lowest savings.
The Savings column (Figure 26) contains savings dollars for each item in the project. Project savings compares what has actually been paid for items after contracts are awarded to what was paid before. For this panel, the Savings column is the default sort column, in descending order, from highest to lowest savings.
![]() Pre-Award Purchase Price (Figure 26) is the price from the item vendor record before any contract was awarded on the project. To display detailed transaction information about a pre-award purchase price, click the desired value in the column. Figure 27 is an example of the popup that appears.
Pre-Award Purchase Price (Figure 26) is the price from the item vendor record before any contract was awarded on the project. To display detailed transaction information about a pre-award purchase price, click the desired value in the column. Figure 27 is an example of the popup that appears.
![]() Comparable Spend (Figure 26) is the item spend for the time frame used in the savings calculation.
Comparable Spend (Figure 26) is the item spend for the time frame used in the savings calculation.
Click the Excel icon ![]() to export the Project Savings Details panel to Excel. You can open the spreadsheet, and save it later, or immediately save it to a network file.
to export the Project Savings Details panel to Excel. You can open the spreadsheet, and save it later, or immediately save it to a network file.
The Excel export includes the panel's fields, and these columns that are not visible on the panel:
Pre-Award Purchase Price Date - The last date when the pre-award purchase price was valid.
Last Purchase Price - The price of the item when it was last purchased.
Last Purchase Price Date - The date of the last purchase of the item.
MMIS Price - The "landed" price from the item vendor record in the site's MMIS system's item file, or in the Item Catalog.
Contract Price - The "landed" price from the contract.
Contract No - The contract number.
Contract Name - The contract name.
Contract Status - Matched or activated
UNSPSC and UNSPSC Description - UNSPSC information for the item.
Item Class and Item Class Description - The class that the item belongs to (if any), as designated by the site.Item Sub Class and Item Sub Class Description - The subclass for the item, if any.
For any given project with awarded contracts, you can view savings data from the Savings panel on the "Work with Project" page (Figure 25).
The same tools are available as from the Savings feature menu (on the main Table of Contents), but arranged slightly differently. Figure 28 is an example.
The Period and View tools on the left function the same as described previously.
Similarly, mousing over the Org for an item displays a "+" Click the + for item details.
Excel Export: The Project Savings Details data can be exported in Excel format.
Savings Opportunities consist of spend from file and non-file purchases on an imported, accepted or activated contract where the purchase prices are higher than contract prices. Spend may be from matched or activated file items and matched non-file items.
Savings Opportunities compares what you have actually paid to what you would have paid, if you’d correctly purchased the item at the contract price. Savings Opportunities assists you in recognizing and recouping the losses resulting from these purchases.
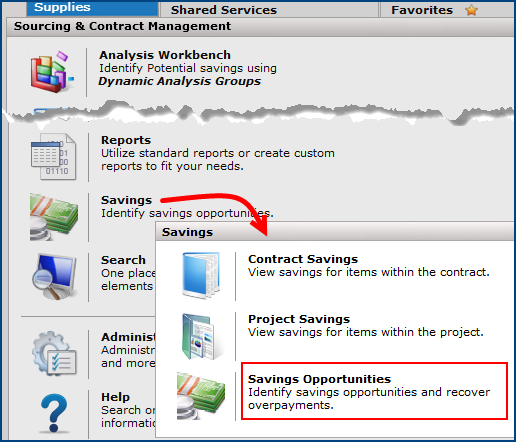
The Savings Opportunities page contains two tabs: Overpayments and Recoverable Savings (Figure 30). The Summary view on the Overpayments tab appears by default.
Overpayments are purchases made at prices higher than the contract price. The Summary View displays the total overpayments by Region. The Detail View displays overpayments by vendor item.
Recoverable Savings consists of items that were previously displayed in the Overpayments tab, but were moved off the list after the contract price, purchase price, and (in the case of file items) the MMIS price for each of the items were reconciled.
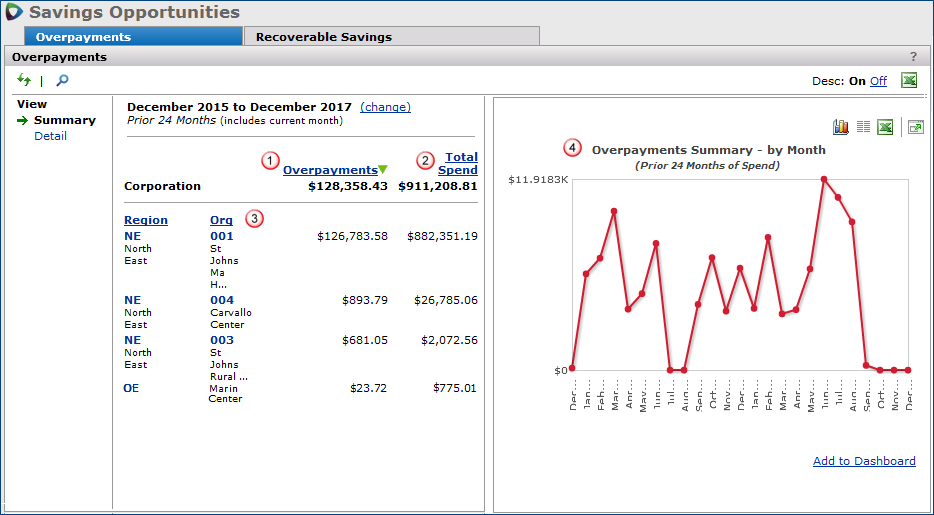
The default view for the Overpayments tab is the Summary view (Figure 30). The first line on the left-hand table contains overpayments for an entire Corporation. Beneath the corporation data is a breakdown of overpayments by region and organization. Only organizations with overpayments are listed in the panel. The right-hand graph displays overpayments for the time period by month.
Note: Each number and description in this section matches a corresponding number in Figure 30 above.
 Overpayments (Figure 30) compares what you have actually paid to what you would have paid, if you’d correctly purchased the item at the contract price.
Overpayments only occur when the actual amount paid is higher than the contract price.
In other words, when you have a contract price for an item, but purchase the item at a price that is higher than the contract price, you have an overpayment.
Overpayments are computed for file and non-file items for the prior 24 months (including the current month), or for the period you specify. Click change next to the date range to select a different time frame. The Overpayments amount is based on only those Spend transactions that have a PO number. For the corporation in Figure 30, overpayments over the prior 24 months is $128,358.43.
 Total Spend (Figure 30) is the spend for the prior 24 months (the default setting) or for the period you specify. The overpayments and total spend values appear together to provide context in terms of what was spent. In Figure 30, the corporation's overpayments are based on spend of $911,208.81.
 On the panel, overpayments are displayed by region and organization (Figure 30). The table (left side) is sorted by default using the Overpayments column in descending order, with the "worst" (highest overpayments) to the "best" (lowest overpayments). A green arrow
 ![]()
![]() indicates the sort column and the direction of sort.
indicates the sort column and the direction of sort.

 The graph on the right-hand side of the panel (Figure 30) plots the corporation's overpayments by month for the time period, except for the current month.
The graph changes depending on the time frame selected, and the region(s) or organization(s) in focus in the table. For example, if you filter on the NE region in the table, the graph displays only data for the organizations in that region. Mouse over any month's node to display the overpayment value.
Display icons are on the upper right of the graph:
Excel Export: The Overpayments data can be exported in Excel format.
Filters: On the Overpayments panel, you can filter by Region, by Org, or by both.
Figure 32A - Filtering the |
Figure 32B - Filtering the |
Figure 33 is the result of filtering Figure 32A by Region. The Filters tool on the upper left specifies how the data are filtered.
Notice that the graph displays data for the filtered region (NSMC).

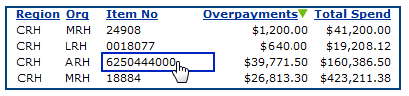
On the Overpayments panel, click the Detail view to see a detailed list of overpayment dollars by organization. The Overpayment details panel appears; Figure 34 is an example. This panel displays items with a calculated loss — that is, items where the amount spent is greater than the amount that would have been spent if the item had been purchased at the contract price.
The default sort order is by Overpayments — highest ("worst") to lowest ("best"). Clicking any underlined column header sorts the display by that column. The green arrow ![]()
![]() indicates the sort column and the direction of sort.
indicates the sort column and the direction of sort.
You can export the panel to Excel by clicking the Excel icon ![]() in the upper right. When you export Overpayment Details data to Excel, several additional columns of information are provided that are not available on the display panel:
in the upper right. When you export Overpayment Details data to Excel, several additional columns of information are provided that are not available on the display panel:
You can also print a report containing details of your region or organization's overpayments. Browse the Report Dictionary for the report object "Overpayments." (For an overview of creating ad hoc reports, refer to the online documentation.)
If you had set a filter for a region or organization on the Overpayments panel Summary view, the filter persists to the Overpayment Details panel. You would see overpayment details for the filtered region or organization. Similarly, if you selected a new date range on the Overpayments panel Summary view, the time frame is applied to the Overpayment Details panel as well.
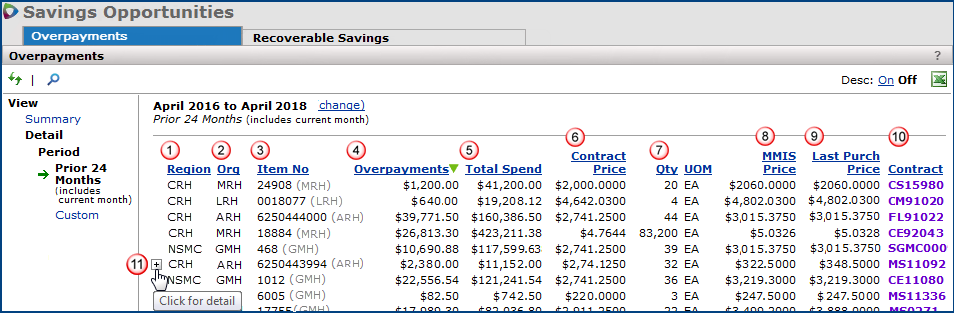
These are the columns on the Overpayment Details panel (Figure 34):
Note: Each number and description in this section matches a corresponding number in Figure 34 above.
Region - A region defined in your site's records. If you do not use regions, this column does not appear.
Org - An organization at your site. If your site uses regions, the region for each organization is listed.
 . Click the plus sign to open item savings details.
 Item No - The item number from your MMIS system's item vendor record.
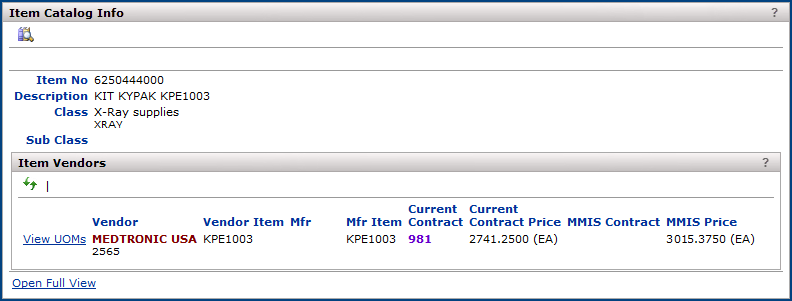
You could use the search on this panel (click ![]() ) to find an item number. If the system finds the item, the result will display all the regions and organizations that purchased the item and had overpayments. This approach is useful when you have items that are not being purchased at the contract price, so that you will know what organizations to contact about the problem.
) to find an item number. If the system finds the item, the result will display all the regions and organizations that purchased the item and had overpayments. This approach is useful when you have items that are not being purchased at the contract price, so that you will know what organizations to contact about the problem.
|
Figure 35 - Item Catalog Info Panel |
Overpayments - Spend for the item that is over and above what you would have paid had the item been purchased at the contract price. (Figure 34)
 Total Spend - All spend for the item during prior 24 months. (Figure 34)
 Contract Price - The "landed" price of the item from the contract that was current at the time the purchase was made. (Figure 34)
 Qty, UOM - The quantity purchased, and the unit of measure for the quantity. (Figure 34)
 MMIS Price - The purchasing price for the item according to your MMIS records. (Figure 34)
 Last Purch Price - The price at which the item was last purchased. (Figure 34)
 Contract - To view the contract associated with this item, click the purple contract number.
(Figure 34)
Contract - To view the contract associated with this item, click the purple contract number.
(Figure 34)
![]() Click for Detail - To view item details and drill down to the item contract, hover to the left of the item and click on the icon. (Figure 34) The Item Details panel will display.
(See Figure 38.)
Click for Detail - To view item details and drill down to the item contract, hover to the left of the item and click on the icon. (Figure 34) The Item Details panel will display.
(See Figure 38.)
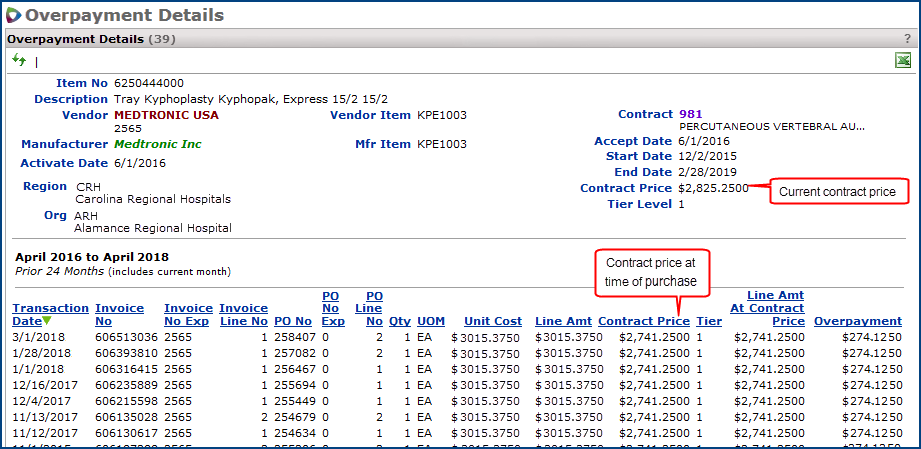
When you find an item with overpayments, you will want to explore when and how the overpayments occurred. For example, as in the discussion above, item number 6250444000 has overpayments of $39,771.50. The Overpayment Details list (Figure 34) displays this value, Total Spend, the Contract Price, etc. Here is the part of the list (Figure 36) that contains the item. The MMIS Price and the Last Purchase Price ($3015.3750) are more than the Contract Price ($2741.25). The item is not being purchased at the contract price.
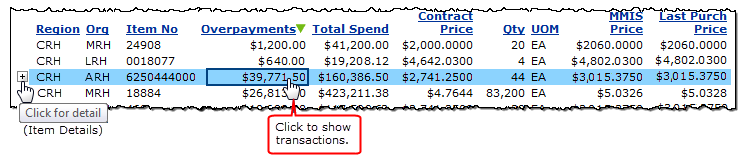
No purchases in the past several months were made at the contract price. Instead, the unit cost of the item in each purchase order is $3015.375. (On the Overpayment Details transactions panel, only purchasing transactions that contribute to the overpayments are displayed. The displayed data is sensitive to the time frame defined in the Overpayment Details panel.)
next to the region displays item details (Figure 37). (If your site does not use regions, the appears next to the Org value.)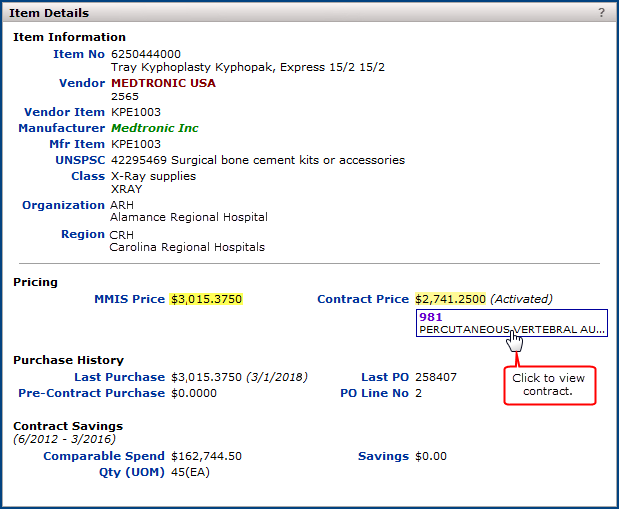
Since the item is activated, the MMIS price should reflect the contract price, but it does not. The yellow highlight indicates a difference between the prices. (Were the item only matched, and not activated, we might not expect the MMIS price and contract price to be the same.) One possible reason why purchases are not being made at the contract price is that the MMIS price has not been updated to the contract price.
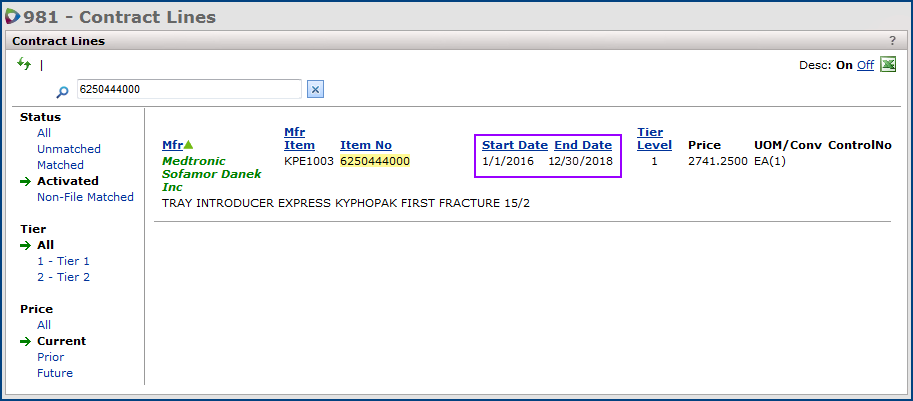
The Start and End dates (Figure 39, see the purple box) show that the contract price of $2741.25 has been available for awhile.
Conclusion: Clearly, several actions are needed as a result of the overpayments data. First, the contract price of this item (and probably others) needs to be exported to the hospital's MMIS system. Secondly, since multiple purchases may have been made since the contract price was activated, a discussion with the contract partner or manufacturer may be useful to try to recoup some of the overpayments.
Recoverable Savings displays items that were previously included in the Overpayments list, but have since migrated to the Recoverable Savings list for one of the following reasons:
Once an item has migrated to Recoverable Savings, it is displayed on the Details tab with a status of "New." As steps are taken to recover the identified overpayments, you can change the status to "In Progress," "Recovery Pending," and finally to "Recovered." If the overpayments cannot be recovered from the vendor, the status can be set to "Unrecoverable."
Once an item's status has been changed from "New," any future overpayment for that item will be treated as a new, separate event and will be displayed on the Overpayments tab. If the status remains unchanged, then any future overpayments will cause the item to migrate back to Overpayments and off the Recoverable Savings list.
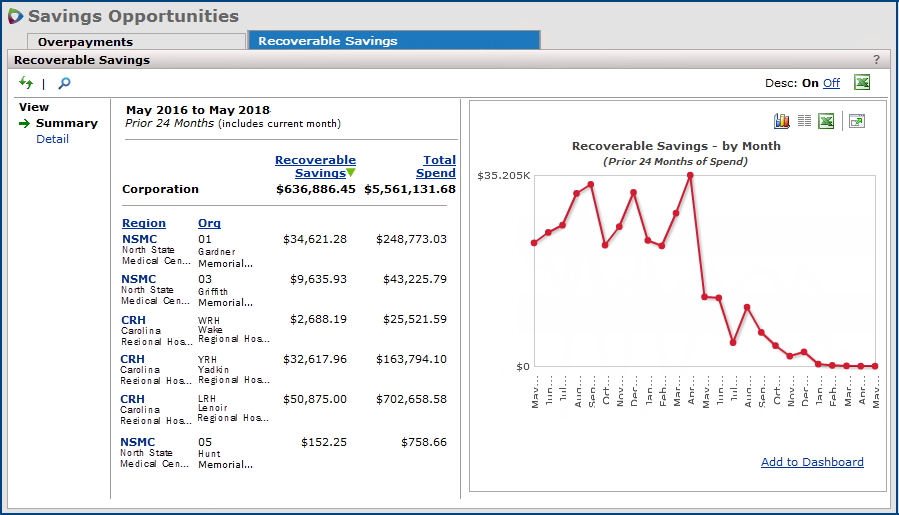
The Recoverable Savings Summary view displays the rolled up amount of recoverable savings at the Region/Organization level and a graph of Recoverable Savings by month. (See Figure 40 below.) The default view displays the prior 24 months of spend, including the current month. The recoverable savings amount excludes items that have been marked as "Unrecoverable" or "Recovered."
Recoverable Savings data includes all items that were formerly listed on the Overpayments tab, but have been moved to Recoverable Savings because their contract price, last purchase price, and catalog or MMIS price (for file items) have been made equal. Also displayed are vendor items from Overpayments whose last purchase price is less than the current contract price, as well as vendor items from the Overpayments list whose contracts have expired.
The Recoverable Savings detail view enables you to see the total recoverable savings by vendor item for the period specified. The vendors listed are those that were formerly listed on the Overpayment Details tab, but have migrated to Recoverable Savings.
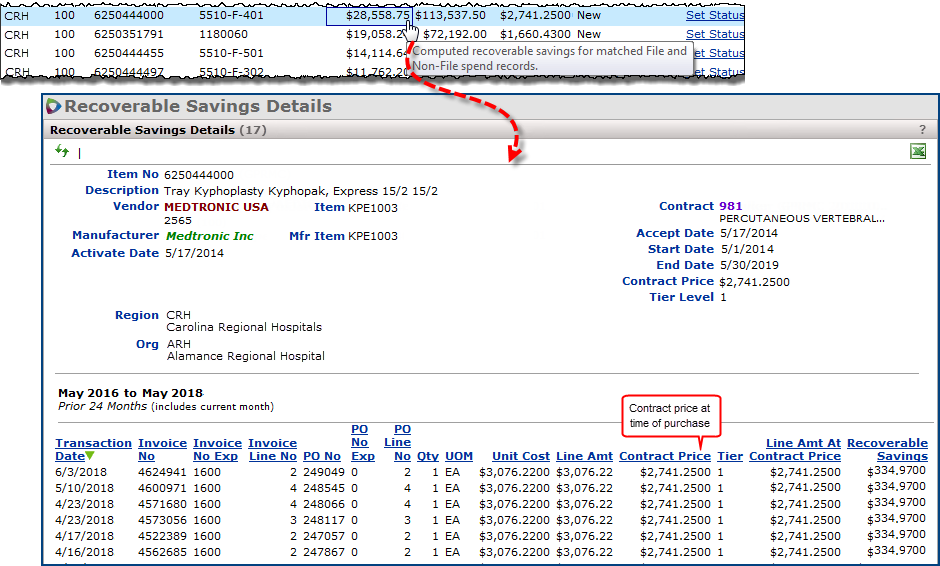
The Recoverable Savings column on the Recoverable Savings detail view (Figure 41) shows the computed recoverable savings for matched file and non-file spend records. (Hovering over an amount in the column brings up a tool tip containing the definition for Recoverable Savings.) This amount is computed using the formula
(Total Spend) - (Contract Price * Quantity).
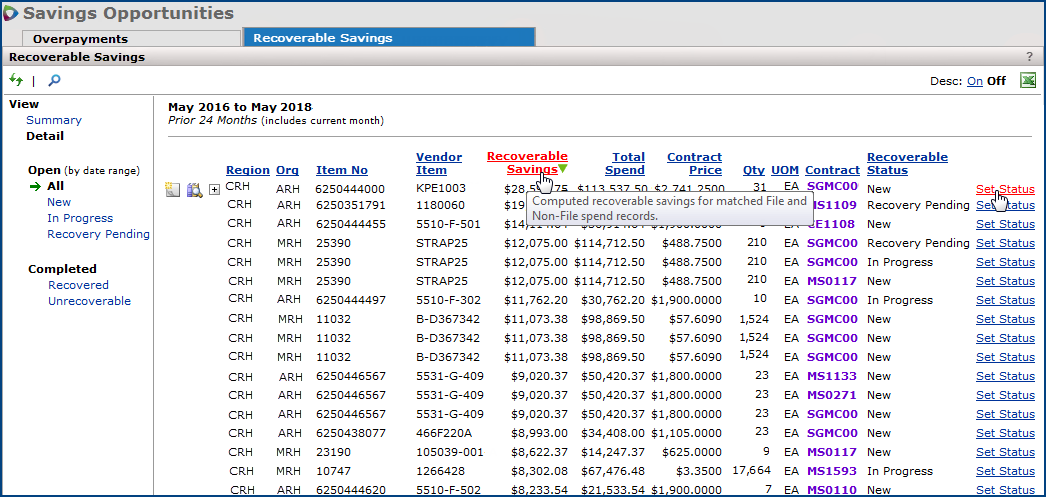
The Recoverable Savings detail view (Figure 41) provides a way to track the status of the overpayment items as actions are taken to recover savings. When an item initially appears on the Recoverable Savings list, the system sets its status to New. As you take action to recover the overpayments, you can change the item's status to one of the following:
*Items with a status of "Recovered" or "Unrecoverable" are excluded from the rolled up Recoverable Savings amount displayed on the Recoverable Savings Summary view.
Notes:
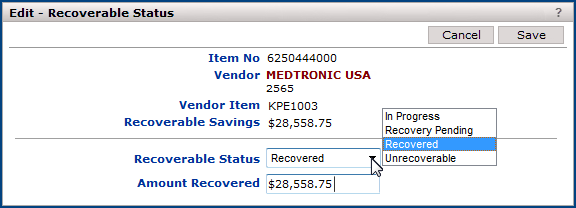
To change the status, click the Set Status link (see Figure 41). The Edit Recoverable Status popup appears (Figure 42). Select the appropriate status from the list. If you select "Recovered," an (editable) Amount Recovered field will display. If you select "Unrecoverable," a Reason field will display.
You can also add notes to the item to detail the steps being taken. Click the  icon to the left of the item line to add a new note. (See Figure 43 below.) Click an existing note to edit it.
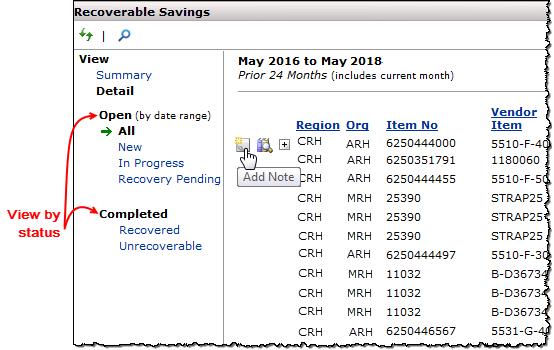
If you wish to view items by status, select the desired sort in the left panel under Open or Completed. (See Figure 43, above.) The default view is Open: All. The Recovered or Unrecoverable views are not restricted by the selected date range.
You can drill down to even more detail within the Recoverable Savings Detail view. Clicking the icon next to the item line will display the Item Details panel (Figure 44). Notice that on this panel, the MMIS Price and Contract Price are equal. The Item Details panel shown in Figure 38 was accessed from the Overpayments list, and it shows an MMIS Price that is different from the Contract Price. These prices must be made equal before the item can be moved to Recoverable Savings.
To display a list of transaction details for an item, you can click on the Recoverable Savings amount for that item on the Recoverable Savings Detail View. (See Figure 41. A portion of this panel is shown in Figure 45 below.) These transactions are listed on the Recoverable Savings Details panel (which may be multiple pages), where you can view the line amount for the item as well as the line amount at the contract price, and see the recoverable savings for each transaction listed. Hovering over an amount in the Line Amt At Contract Price column or the Recoverable Savings column will bring up a tool tip that explains how the amount was computed.
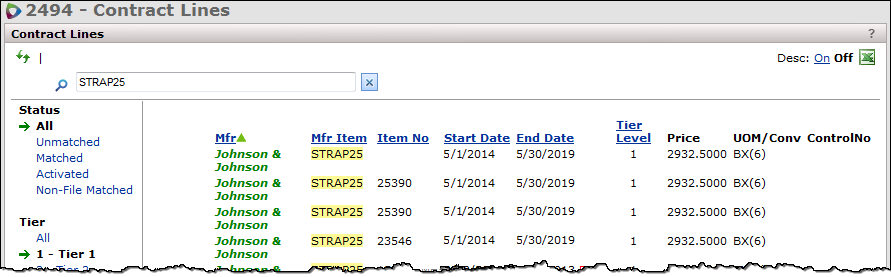
Clicking on the Contract Price in the header of the Recoverable Savings Details panel above displays the contract lines for the item contract. See Figure 46 below.
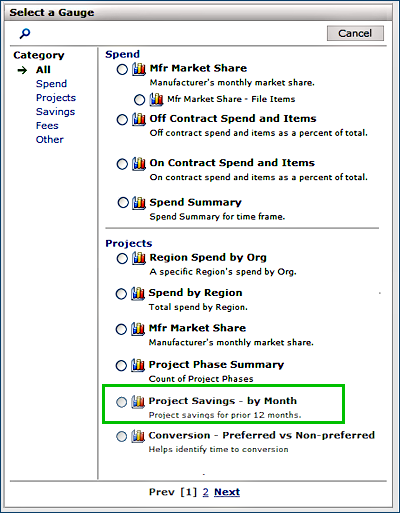
Savings gauges are available for dashboards so that you can display savings in a quickly-accessible form. The selection panels for the gauges are displayed in Figure 47.
 |
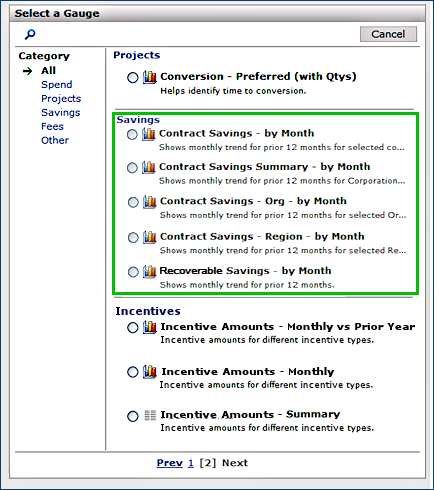 |
Details on setting up and using dashboards are in the online documentation topic "Using Dashboards."
Copyright © 2023 by Premier Inc. All rights reserved.