Dashboards are collections of gauges -- such as spend graphs and tables -- that you wish to locate together in a convenient place for easy monitoring. This section describes how to create and access dashboards for reviewing and analyzing contract spend, savings, manufacturer market share, incentives, and progress on contracting projects.
Customers have the option of enabling/disabling the Dashboards feature as part of their SCM package. This feature is enabled by default.
When the Dashboards feature is enabled, the ability to add gauges to a dashboard is available. The Dashboards menu element appears on the SCM main Contents, and users can work with it.
When this feature is not enabled, users cannot work with dashboards. The Add to Dashboard link does not appear for gauges, and the SCM main menu does not provide a Dashboards element.
Contact the Help Desk or your Premier Consultant to enable or disable this feature.
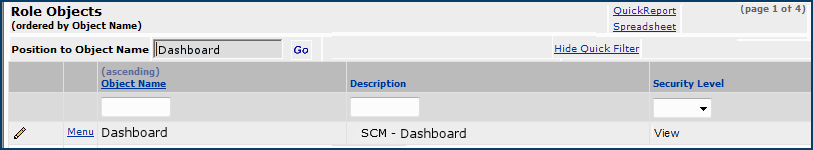
To work with a feature in the Sourcing and Contract Management table of contents, the appropriate security role object for the feature must be set to View, minimally. The “Dashboard" role object controls access to the features My Dashboard and Add to Dashboard. Users must have a minimum security level of View to create and access a dashboard (Figure 1). If security is set to None, the the user cannot work with the dashboard feature. When a user does not have the appropriate access level, the dashboard links are disabled (gray in color with a tool tip).
For details on working with roles, see Work with User Roles.
From the main Contents, on either the Supplies or Services tab, click Dashboards.
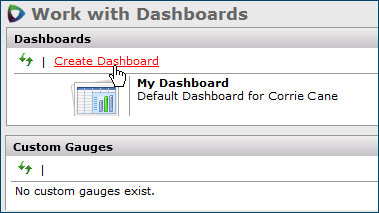
A list of dashboards and a link to the Work with Dashboards feature appears (Figure 2).
Note: The user's "Dashboard" security role object must be set minimally to View. If security is set to None, Dashboard does not appear in the table of contents for the user.
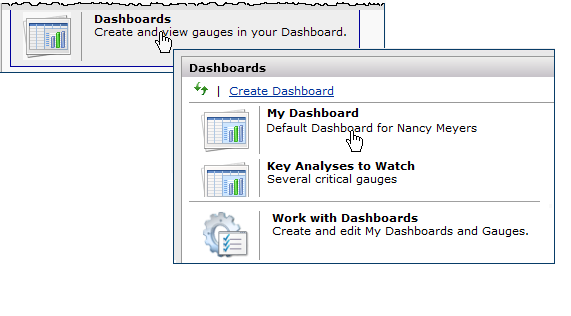
Figure 3 is an example of a dashboard.
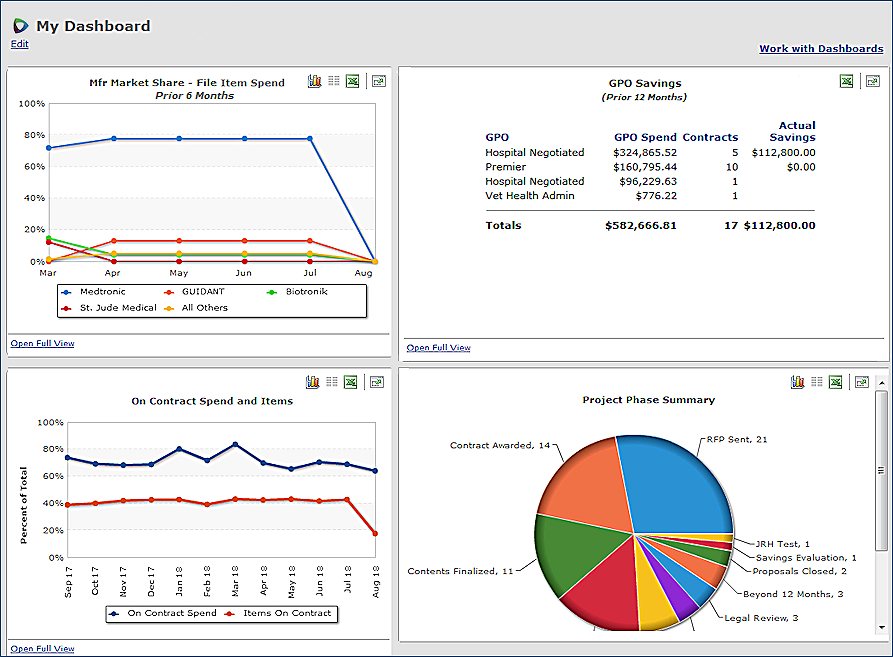
The Dashboards feature lets you copy pertinent gauges to a central location so that you can track changes efficiently. You can create multiple dashboards, and include the same, or different gauges on each. The gauges that you insert on a dashboard are updated dynamically. For example, a graph that displays spend data is updated as spend dollars increase.
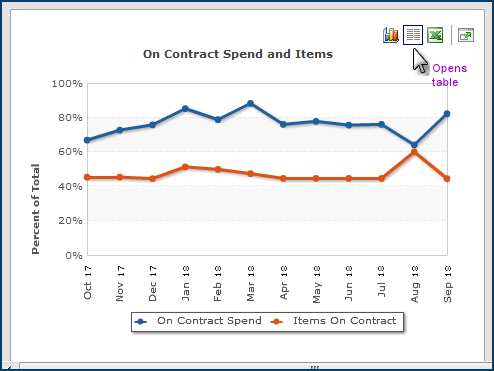
For gauges on a dashboard, and for the same gauges in various parts of the application (such as in supply contracts Projects), you have the option of displaying information in several forms: as a table, graph, or Excel spreadsheet.
Figure 4 - On Contract Spend and Items Gauge |
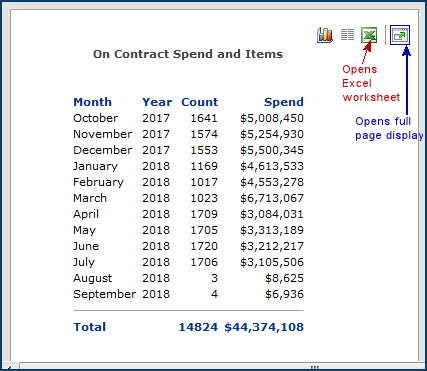
Figure 5 - On Contract Spend and Items Gauge |
Note: Not all three display options -- table, graph, Excel spreadsheet -- exist for every gauge.
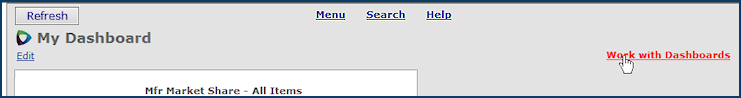
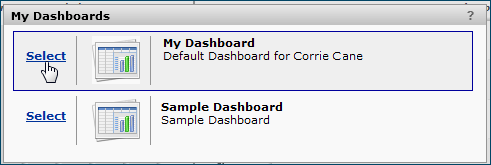
Dashboards are accessible from the My Dashboards link on the page menu (Figure 2).
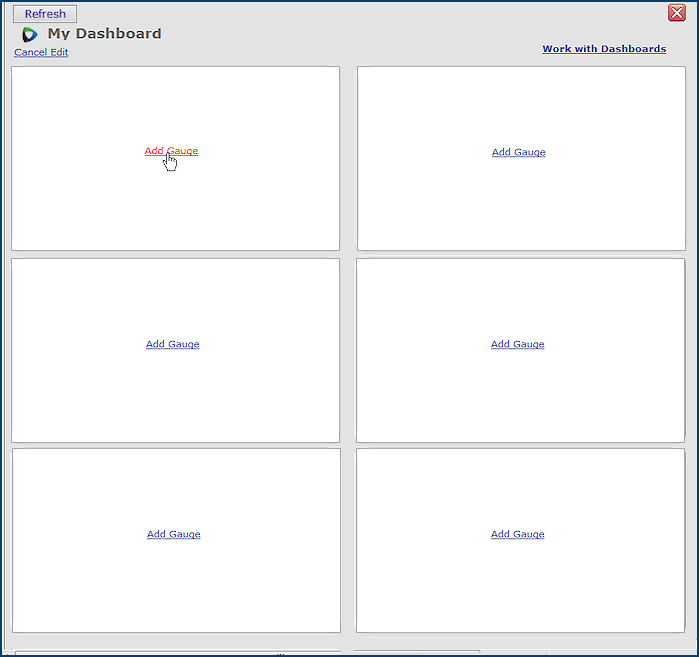
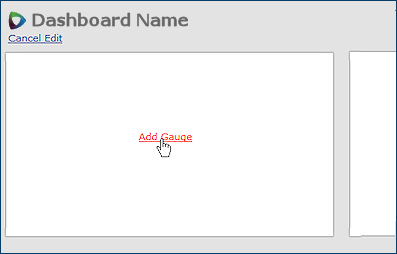
The first time that you click Dashboards > My Dashboard, the default dashboard My Dashboard appears. The Dashboard Edit panel contains blank spaces for you to insert gauges (Figure 6). The dashboard labeled My Dashboard will be your primary dashboard (you can create others).
Next, you want to add gauges to the dashboard.
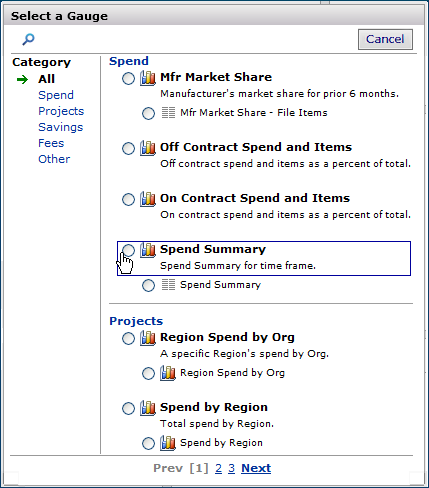
A list of gauges appears. Figure 7 displays part of the list.
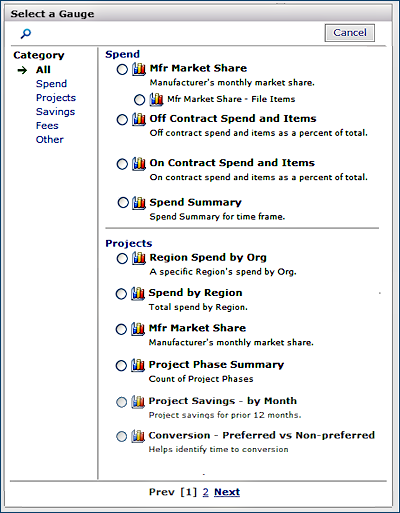 |
When you mouse over a selection circle, a tool tip appears that identifies the gauge either as a "Standard Gauge" or a "Custom Gauge."
Note: Some gauges are only available for supply item spend; such as project gauges.
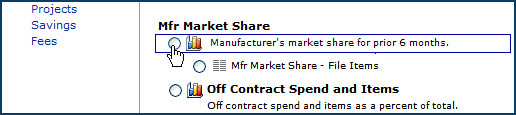
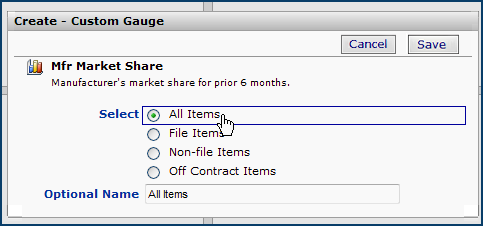
For some gauges, such as Mfr Market Share (Figure 8), a selection list for the type of items or spend appears (Figure 9A). You may need to specify other parameters as well for some gauges; for example, a range of months for which the system should display data.
In the location for the new gauge, you can...
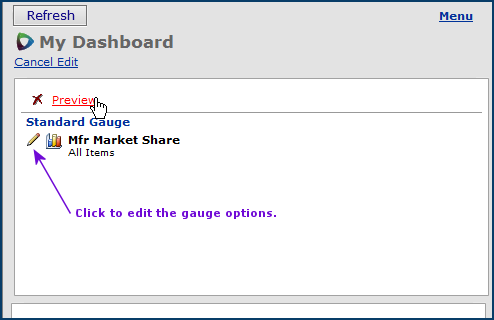
- Click Preview to display the image of the gauge...a graph, for example.
- Click the edit icon
to select different gauge options or change options that you originally selected (such as the time period or title).
- Click the delete icon
if you decide that you do not wish the gauge to be displayed.
At the top of the panel, Cancel Edit closes the Dashboard feature.
This example explains how to select options for the Spend Summary gauge and add it to a dashboard.
From the main Contents, click Dashboards (Figure 2).
A list of dashboards that you have created appears.
(If you have not yet created any dashboards, see "Create Your First Dashboard."

The Dashboard Edit panel appears.
A list of gauges appears.
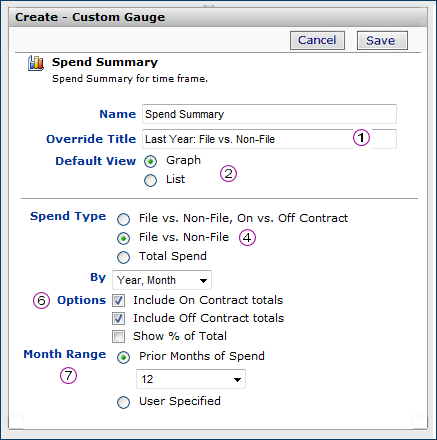
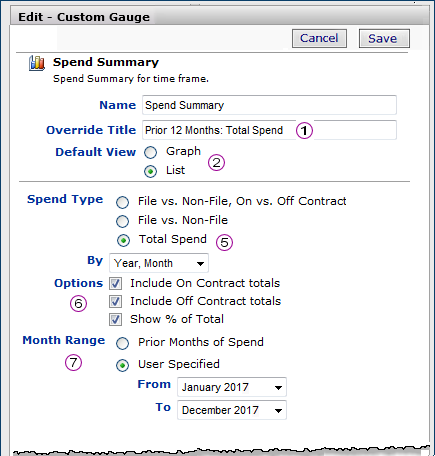
A panel appears with the Spend Summary options (Figure 14).
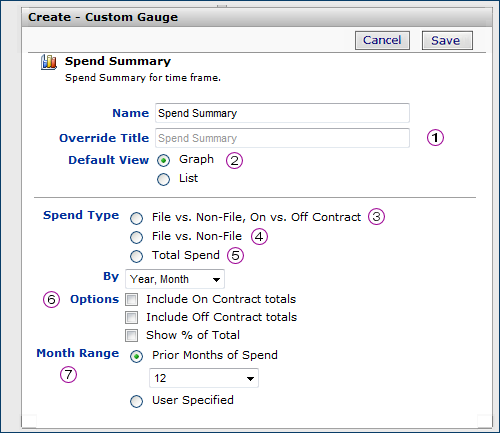
Override Title - You can delete the title in gray text and enter another title for the gauge, if you wish.
Default View - Select either a graph or a table view of the spend summary data. (Graph is the default.)
Spend Type: You can select multiple types of spend if you wish to view comparisons.
Spend Type: File vs. Non-File, On vs. Off Contract - Displays file, non-file, on-contract and off-contract spend comparatively for the time period.
Spend Type: File vs. Non-File - Displays file and non-file spend comparatively for the time period.
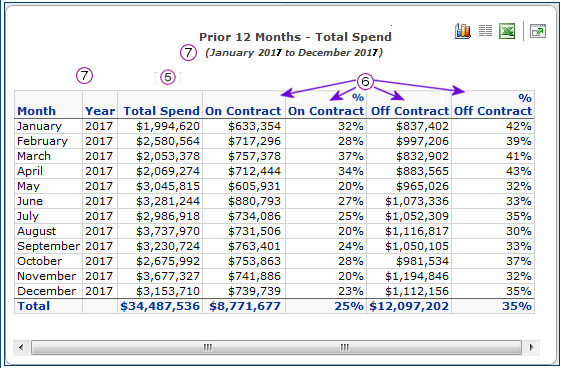
Spend Type: Total Spend - Displays all spend for the time frame, in comparison to other types of spend.
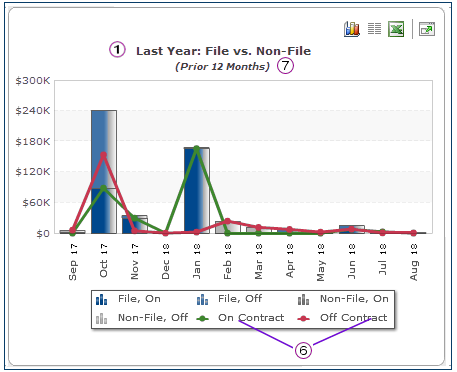
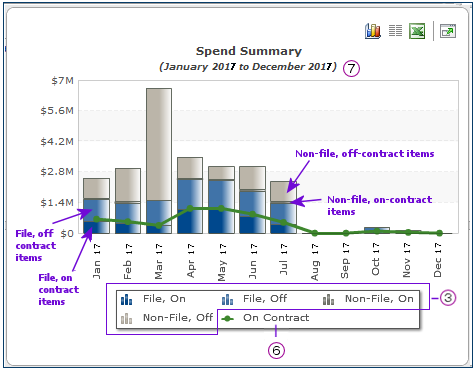
Include On Contract Totals: For graphs, this option displays a histogram (line graph) of totals for on-contract items. The line graph appears on top of the bar graphs for Spend Type.
(See examples in the table.) For tables, this option displays a column for on-contract totals.
Include Off Contract Totals: For graphs, this option displays a histogram (line graph) of totals for off-contract items. The line graph appears on top of the bar graphs for Spend Type.
(See examples in the table.) For tables, this option displays a column for off-contract totals.
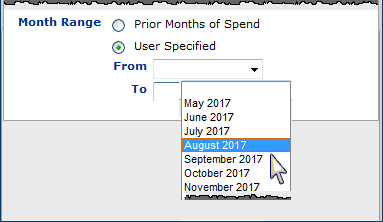
Month Range: Select a time frame for the spend.
For the Month Range, if you select Prior Months of Spend, click the down arrow to choose a number of months. Spend is displayed on gauges for full months. Alternately, you can select User Specified, which opens the From and To fields: select a From month/year and a To month/year
Summary Gauge Option Settings |
Sample Results |
Figure A1 |
|
Figure B1 |
|
Figure C1 |
Figure C2 |
Once you have created your first dashboard, you may wish to create others to segregate your gauges in some way. You can easily create and access multiple dashboards, and add gauges.
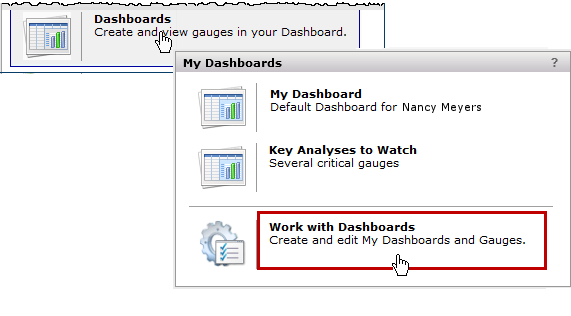
Alternately, if you are working within an existing dashboard, and wish to create another, click Work with Dashboards (Figure 16).
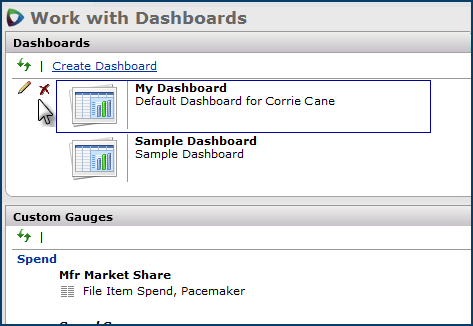
The "Work with Dashboards" page appears with two panels (Figure 17).
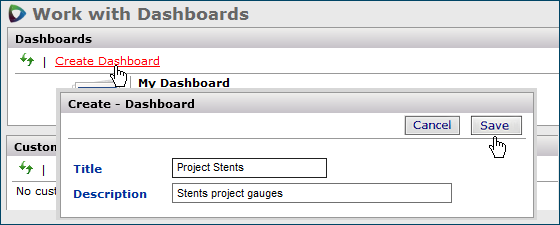
You can change the title or description of dashboards that you have created, and you can delete any dashboard.
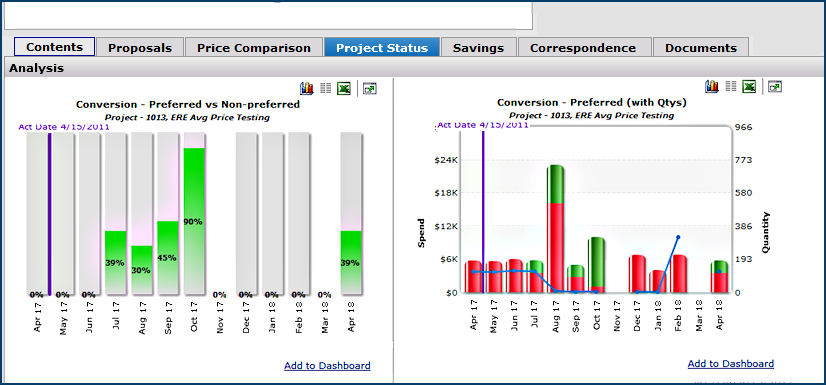
When a project reaches the stage in which contracts have been awarded and conversion rates are being tracked, you can add the conversion gauges to dashboards.
For example, in Figure 20, a project has a contract activation date established for an awarded contract. The Conversion gauges on the project Status panel display how much of each subsequent month's spend occurs on the new contract. You can add one or more gauges to a dashboard so that you do not need to open the project whenever you wish to view conversion rates.
Note: If the Dashboard feature is not enabled for your site, the link Add to Dashboard does not appear on any SCM gauge.
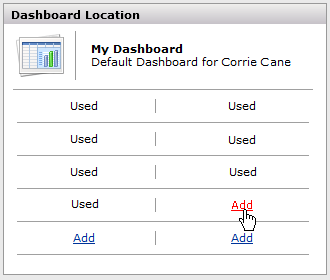
The next time you open the dashboard to which you added the gauge, the gauge appears.
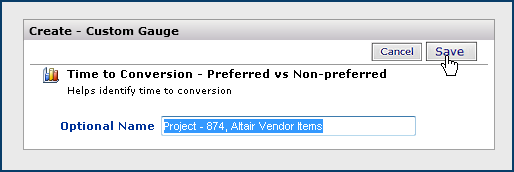
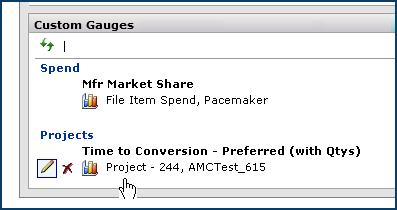
Once you have added a custom gauge to a dashboard, you can change the name of the gauge if you wish.
Copyright © 2023 by Premier Inc. All rights reserved.